 EN
EN
 AR
AR
 FR
FR
 DE
DE
 PT
PT
 RU
RU
 ES
ES
 TR
TR
News
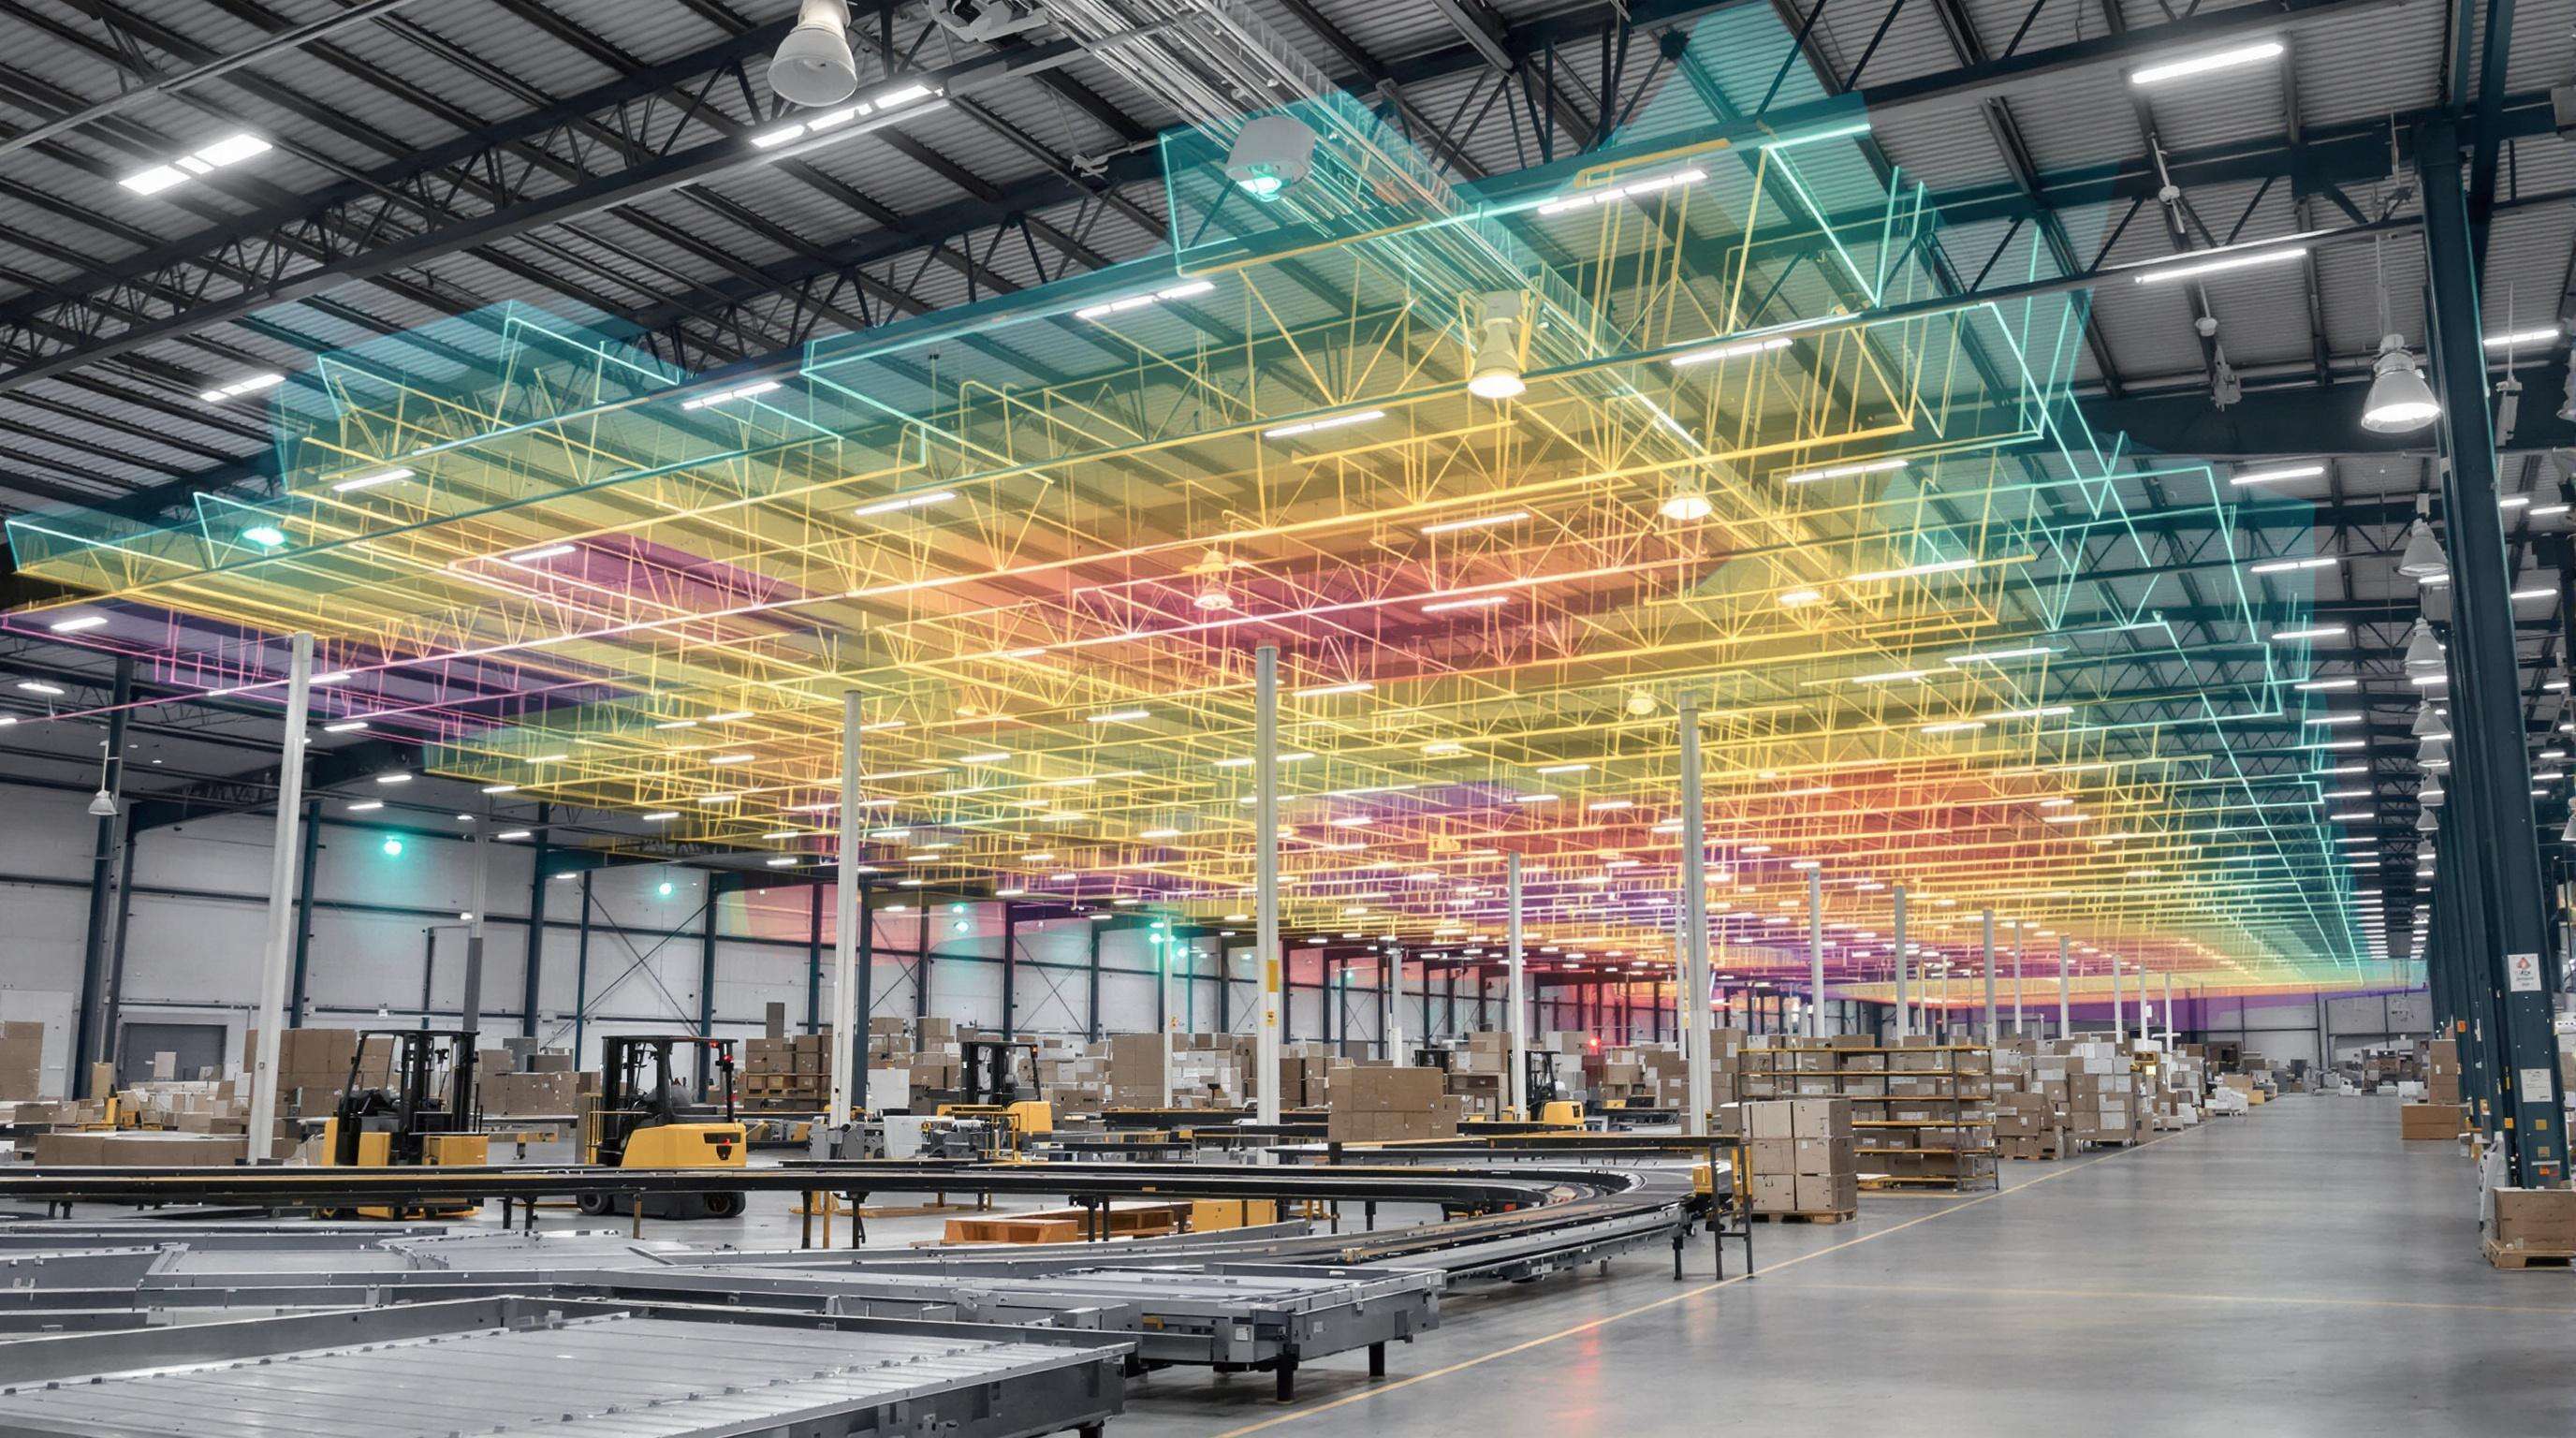
Internal Logistics Heat-Maps to Spot Energy Waste in Busy Warehouses
What Are Internal Logistics HeatMaps and How They Improve Energy Efficiency
Definition and Core Function of Internal Logistics HeatMaps
HeatMaps for internal logistics basically show where energy gets used in warehouses through colored overlays on layout diagrams. Red areas mean lots of power being consumed, green spots indicate lower usage levels. These maps pull information from various sources including those fancy IoT sensors around the facility plus data from warehouse management software. The system tracks how much electricity different machines consume like conveyors running all day long, heating ventilation air conditioning units working overtime, and even those electric forklifts zipping between storage racks. When these heatmaps highlight problems such as workers taking similar paths repeatedly or certain sections of the warehouse sitting idle most of the time, they reveal where energy is going to waste without anyone noticing. This kind of insight helps managers focus their efforts on specific trouble spots rather than trying to fix everything at once.
Linking Material Flow Data to Energy Consumption Monitoring
Heat maps bring together data on how materials move around warehouses, including things like how far AGVs travel and how often pallets get picked up, along with information about energy usage. Take for instance those constant back and forth trips made by forklifts in cold storage rooms which actually makes the heating and cooling systems work harder, sometimes increasing their runtime by about 30 percent according to research from AJOT last year. When these connections between movement patterns and energy consumption become visible, warehouse managers start seeing where all that extra power is going. Old fashioned routing methods tend to leave lights burning in corners of the facility that hardly anyone goes near anymore, wasting electricity without anyone even noticing it happening.
The Role of Simulation-Based Energy Assessment in HeatMap Accuracy
Simulation tools help businesses test how things might change operationally during different seasons or when they rearrange their space layouts, all while predicting what happens to energy usage before making actual changes. According to research published in 2024, certain warehouses saw their energy bills drop about 28 percent after implementing these simulation based HeatMaps. The system helped them move automated guided vehicles away from areas where temperatures were too high and made better use of conveyor belts throughout the day. Another benefit? These same simulations check sensor readings against standard metrics such as Energy Use Intensity (EUI). This process helps fix errors that come up because old equipment doesn't always give accurate baseline measurements anymore.
Key Energy-Waste Detection Workflow:
- Data Collection: IoT sensors capture forklift idle times, refrigeration cycles, and lighting usage.
- Correlation: Algorithms link energy spikes to operational events (e.g., peak-hour loading delays).
- Optimization: HeatMaps recommend actions like staggered shift schedules or zone-based HVAC controls.
For a deeper analysis of sensor-driven energy monitoring, explore this Warehousing Energy Trends Report.
Identifying Energy Waste Hotspots in High-Traffic Warehouses Using HeatMaps
Detecting High-Consumption Zones with Energy Consumption Mapping
Warehouse managers rely on internal logistics heatmaps to see where energy gets used most in busy spots like loading docks, refrigerated storage areas, and those automatic conveyor belts everywhere now. When they combine live equipment power readings with information about who's around and what materials are moving through, these colorful maps highlight where money is being thrown away. The Green Warehouse Initiative reported last year that nearly a third of all lighting and heating costs in heavily trafficked areas just disappear when nobody's actually there. Smart warehouses track their efficiency with something called Energy Use Intensity or EUI for short. Top performers manage to keep their annual consumption below about 0.7 kilowatt hours per square foot by making changes based on what those heatmaps show them.
Analyzing Material Flow Patterns Against Energy Performance Indicators (EUI, CO2e)
Heat maps track how pallets move around, where vehicles go, and when equipment sits idle, linking all this activity to actual carbon emissions and energy use intensity so companies know where to focus their green efforts first. Take a standard warehouse that puts out about 12,000 metric tons of CO2 each year just running operations. Simple changes matter here too - moving forklifts out of temperature controlled areas alone could slash those numbers down by nearly 20%. Smart scheduling makes a difference too. When warehouses plan picking tasks to happen between air conditioning cycles instead of right alongside them, they avoid hitting maximum power consumption at once, which means less stress on electrical systems during peak hours.
Case Study: Cutting Energy Waste in a 500,000 sq. ft. Distribution Center
A logistics provider reduced energy costs by 18% ($240,000/year) after heatmap analysis revealed three key issues:
- Overlapping AGV routes causing congestion near high-draw refrigeration units
- Inefficient dock door sequencing triggering simultaneous HVAC and lighting spikes
- Legacy forklift batteries charging during peak utility rate hours
By rescheduling workflows and installing occupancy-based zone lighting, the facility achieved a 22% reduction in non-value-add energy consumption.
Balancing Detail and Simplicity: Addressing HeatMap Interpretation Challenges
Heatmaps definitely give detailed information, but sometimes too much data just gets in the way when making actual decisions. According to something I read in Logistics Tech Review back in 2021, warehouse managers who used simple traffic light systems red, yellow, green for alerts were able to make choices about 40% quicker compared to folks staring at raw kilowatt hour numbers all day long. The smart approach is really about setting clear boundaries what matters most. For instance, tracking carbon emissions per pallet shipped over 12 kilograms or looking at energy use index differences that exceed 15% beyond average zones. When we train our staff to connect these findings directly with our warehouse's established energy goals, everyone stays on the same page without getting bogged down by complex data points. It keeps things straightforward while still maintaining proper technical standards.
Driving Warehouse Energy Optimization Through HeatMap-Driven Strategies
Aligning HeatMap Insights with Sustainable Warehousing Goals
Heatmaps for internal logistics can really bring operations into line with green goals like cutting carbon emissions and lowering energy use per square meter. When facilities combine their energy consumption data (kWh/m²) with how materials actually move around the place, these maps show where day-to-day activities don't match up with environmental objectives. A recent study from the 2024 Warehouse Energy Trends Report found something interesting too. Warehouses that implemented heatmap technology hit their Science-Based Targets Initiative benchmarks about 22 percent quicker than places sticking to old school monitoring methods. Makes sense when you think about it though - seeing hotspots visually just makes optimization so much easier to grasp and act on.
Optimizing Material Handling Routes and Scheduling Based on Energy Load
HeatMaps expose how forklift traffic and peak HVAC periods drive unnecessary energy use. Rescheduling replenishment to off-peak hours and rerouting AGVs from climate-controlled zones can reduce energy per pallet moved by 15-20%, based on simulation data. These adjustments maintain throughput while significantly cutting waste.
Enabling Real-Time Operational Adjustments with Live HeatMap Data
Modern heatmap platforms leverage IoT sensors and digital twin technology to deliver live energy feedback, empowering managers to:
- Scale back lighting and HVAC in underused zones
- Dynamically reroute robots during demand surges
- Balance conveyor loads to prevent motor overloads
This responsiveness is increasingly vital, given the International Energy Agency's projection of a 30% rise in warehouse energy demand by 2030.
Resolving the Trade-Off: High Throughput vs. Energy Efficiency
| Strategy | Throughput Impact | Energy Savings Potential |
|---|---|---|
| Peak Load Shifting | ±0% | 12-18% |
| Zone-Based HVAC | -3% | 21-27% |
| AGV Speed Tuning | -5% | 14-19% |
HeatMaps help identify balanced solutions that minimize productivity loss while maximizing efficiency. Facilities applying this approach report 19% lower CO2e emissions per shipment than those prioritizing throughput alone.
Key Technologies Powering Internal Logistics HeatMaps for Carbon Reduction

IoT Sensors and Real-Time Energy Consumption Monitoring Systems
In warehouses today, IoT sensors are constantly gathering energy consumption data every 15 seconds. These smart devices track kilowatt-hour metrics coming from things like heating ventilation air conditioning units, warehouse lighting setups, and those electric forklift charging spots scattered around the facility. When we cross reference all this information with what's happening on the floor in terms of materials moving around, it becomes pretty clear where problems lie. Some machines just sit there wasting power when they shouldn't be running at all, while certain charging areas get way too much traffic compared to others. According to research published last year by the Material Handling Institute, facilities that implemented these kinds of monitoring systems saw their carbon dioxide output drop about 14 percent each year simply because they could identify which equipment needed upgrading first.
Digital Twins and Simulation-Based Energy Assessment Platforms
Digital twins create virtual replicas of warehouses to simulate the energy impact of layout or workflow changes. Modeling adjustments like reconfigured storage or revised picking routes allows facilities to predict savings with 93% accuracy (Logistics Tech Review 2023). Adoption of these platforms has led to 18% reductions in EUI through optimized operations.
| Manual Analysis | Software-Optimized Strategy |
|---|---|
| 6-month audit cycles | Continuous kW/sq.ft tracking |
| Generic CO2 estimates | Site-specific CO2e calculations |
| Static equipment schedules | Dynamic load balancing |
Software Solutions for Warehouse Energy Efficiency and HeatMap Generation
Advanced software integrates IoT and digital twin data into intuitive dashboards that highlight kW/sq.ft variances across zones. Leading platforms now automate corrective actions—such as rerouting AGVs from overloaded electrical pathways—while maintaining 99.7% operational uptime. This integration enables sustained energy savings without compromising throughput.
FAQ
What is the main purpose of internal logistics heatmaps?
Internal logistics heatmaps help visualize energy usage within a warehouse, allowing managers to identify areas where energy is consumed excessively and optimize operations accordingly.
How do IoT sensors contribute to efficient warehouse management?
IoT sensors collect detailed energy consumption data, enabling managers to pinpoint inefficiencies and adjust operations to reduce energy waste and improve overall efficiency.
What are digital twins in warehouse management?
Digital twins are virtual replicas of physical warehouses used to simulate changes in layout or operations, predicting their impact on energy usage and efficiency.
How can heatmaps drive warehouse energy optimization?
Heatmaps provide real-time data insights to implement proactive energy-efficient strategies, helping warehouses align with sustainability goals and reduce carbon emissions.
Recommended Products
Hot News
-
A Vital Freight Mode Connecting The World
2024-01-16
-
The Continued Development Of Our Freight Shipping Company
2024-01-16
-
The Importance Of A Trucking Company
2024-01-16